Why crypto price sources should be selected market by market, starting from volume
Stop scoring exchanges
Date
Author
Gautier Humbert, Research Analyst

The real problem: which market does the price come from?
Every valuation of a digital asset begins with a question that is too often skipped: which market does the price come from? For an asset scattered across dozens of platforms with heterogeneous prices, volumes and integrity, that single decision drives the result far more than any calculation formula. Lacking an obvious answer, the industry built ever more elaborate trust scores: dozens of criteria, weighted and aggregated, to decide which platforms “deserve” to enter the calculation. Our thesis fits in one line: that complexity is the problem, not the solution. A single, already-observable and hard-to-game number, volume, captures most of what those scores try to approximate once basic eligibility, accessibility and data-integrity checks have been passed; in the vast majority of of liquid-asset cases it is enough to identify the right market and derive a fair value from it. That is the approach we have adopted at Koinju, and what this article sets out to demonstrate, with the data to back it.
Exchange scoring: the wrong tool
Adding up things that cannot be added
The most common scoring frameworks rate each platform across a handful of categories: governance, security, liquidity, data quality, regulatory compliance, KYC/AML, transparency. Then, weight and sum them into a single number. A typical weighting might assign, say, 30% to governance, 20% to security, 15% to liquidity, 10% to technology, 10% to data quality. The problem precedes the choice of weights: these dimensions are incommensurable. What does it mean to add together the existence of cold storage, a proof of reserves, an order-book depth figure and a compliance policy? Aggregating such heterogeneous quantities into one number implicitly assumes they offset one another, that additional operational security could buy back, say, a shortfall in liquidity. For price formation, that trade-off is meaningless. A platform with impeccable governance but anemic liquidity can thus rank above a deep, active venue, the exact opposite of what valuation requires, where all that matters is where price is actually discovered.
Arbitrary weights, dressed in false precision
No theory of price formation dictates weighting governance at 30% rather than 25% or 35%. These weights are the vendor's judgments, presented with a decimal precision that disguises their discretionary nature. The same arbitrariness governs the qualification thresholds. And composite indices are notoriously unstable: changing a single weight by a few points can flip a ranking. This sensitivity, rarely disclosed, means a platform's trust rank depends as much on the choices of whoever does the scoring as on the platform's own properties.
To lend these grades a scientific veneer, frameworks often graft on batteries of statistical tests borrowed from other disciplines, meant to flush out fake volume. The display impresses, but it invites two simple objections. First, these tests rest on assumptions, about the expected shape of the data, in particular that hold poorly in crypto markets, where a handful of platforms dwarf all the rest: perfectly honest venues can be flagged in error, while moderately sophisticated bad actors slip through. Second, and above all, the output of these tests is itself converted into points and then weighted: the advertised objectivity dissolves into a fresh layer of discretionary choices.
Self-reported criteria that measure hygiene, not price reliability
A substantial share of these scores rests on self-reported items: certifications, bug-bounty programs, internal policies, proof of reserves, transparency practices. These are checkboxes the platform has every incentive to tick, often with no independent verification. Above all, such criteria measure institutional hygiene, real and worthwhile, but unrelated to the only question at hand: where is the price of a given asset reliably formed? A platform can tick every governance box and still be the site of no meaningful price discovery.
The reasoning error: judging the institution, not the asset's market
This is the deepest flaw in scoring, because it concerns the unit of analysis itself. The fair value of an asset depends only on the markets where that asset actually trades, not on the overall reputation of the institution that hosts them. Yet a composite score judges the exchange as a whole: its team, its insurance, its certifications, its organization. Excluding an entire platform on the strength of an aggregate grade throws away relevant price information, the deep, legitimate market for a specific asset, on the basis of criteria that have nothing to do with that asset. Symmetrically, a well-rated platform may offer only a thin, or even nonexistent, market for the asset in question, and distort the price if included. The right unit of analysis is not the exchange: it is the market for the asset.
The clearest illustration of this confusion is the awarding of points based on the location of the headquarters. Some methodologies apply a fixed jurisdictional ladder: a venue domiciled in one set of countries automatically receives full marks, another a mere fraction. These scales are, moreover, most often Western-centric: they place North America and Europe at the top and automatically demote venues serving vast markets (Indian, Chinese, South Korean) that nonetheless carry enormous economic weight and are, for certain pairs, the actual locus of price discovery. Yet a company's domicile has no bearing on where the price of a given asset is reliably formed. It is arbitrariness elevated into a criterion, precisely the kind of institutional judgment that pollutes a valuation rather than informing it.
The structural conflict of interest, and opacity
This is the most uncomfortable critique. Providers that score platforms frequently maintain commercial relationships with those same platforms: data-feed sales, technical partnerships, licensing agreements, premium placement, badges. When the same entity monetizes its relationship with a venue and decides on that venue's inclusion in a trusted universe feeding financial products, the independence of judgment is, at best, questionable. Add to this the opacity: many scores are proprietary, blended aggregates that are not reproducible by a third party; some administrators even outsource venue selection to another vendor, stacking layers of opacity; and these rankings are reviewed only every three or six months, so that at a given measurement date one relies on a grade that is months old. For a use case demanding reproducibility, neutrality and timeliness like valuation for financial reporting, these properties are disqualifying.
Volume already holds the answer
Volume is revealed preference, not vendor opinion
Traded volume is not a grade assigned by an analyst: it is the aggregation of the revealed preferences of all participants, expressed with real money. The market that concentrates the most genuine volume is, by construction, where price discovery actually occurs. Crucially, volume is an integrating proxy for everything scores try to measure separately. A platform can attract and retain the highest real volume only if it is trustworthy enough for counterparties to route significant size to it, liquid enough to absorb that size at tight spreads, reliable enough to stay available, and accessible enough to bring those participants in. Where a score asserts trust, volume reveals it and because it integrates that trust into one figure, it is enough to identify the relevant market.
Commensurability, auditability, neutrality
Volume offers three virtues a score cannot. It is commensurable: measured in a single unit, value traded, it makes comparisons homogeneous and dispenses with any arbitrary weighting scheme. It is auditable and reproducible: any third party, auditor, regulator, client, can recompute which accessible venue did the most volume over thirty days and reach the same answer; a proprietary blended score cannot. And it is neutral: volume is observed, not negotiated; there is no commercial lever to move a platform in or out. For a valuation destined for financial reporting, this absence of conflict is not a nicety, it is a requirement.
The proof in the data: always the same venues — and market by market
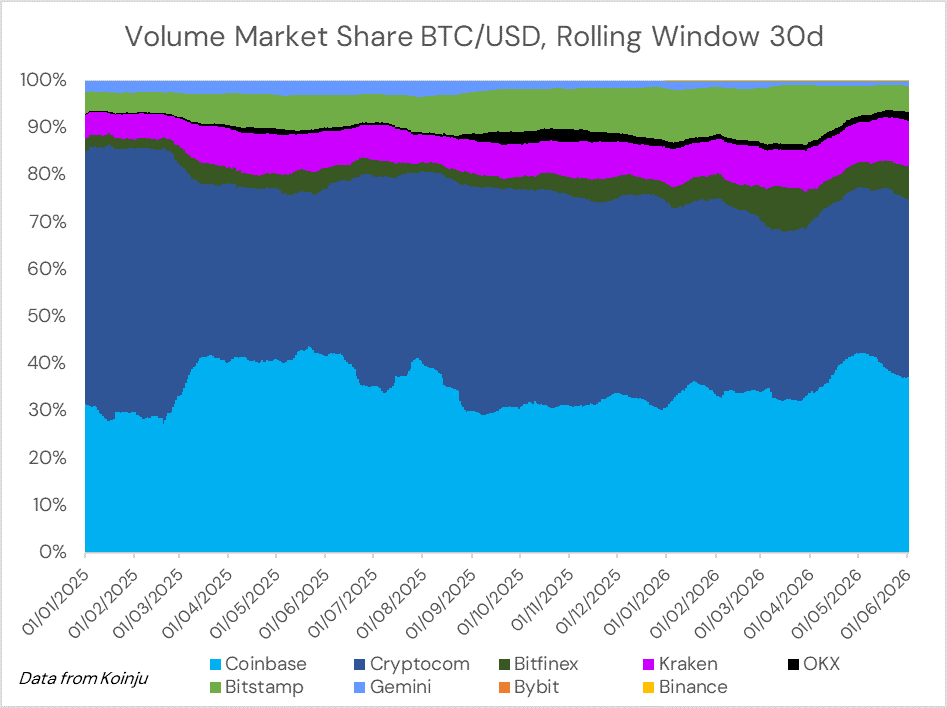
Figure 1. BTC/USD volume market share, 30-day rolling window (Jan 2025 – Jun 2026; source: Koinju). Over seventeen months, just two platforms — Crypto.com and Coinbase — concentrate more than three-quarters of volume, and the top five exceed 95% every single day: the principal market designates itself.

Figure 2. ETH/EUR volume market share, 30-day rolling window (Jan 2025 – Jun 2026; source: Koinju). The leading pack looks entirely different from BTC/USD — Binance and Kraken lead, Crypto.com all but vanishes — proof that the relevant market depends on the asset and its currency, not on the exchange taken as a whole.
Our own data turns the theoretical argument into a measured fact. Across 517 daily observations on a thirty-day rolling window spanning seventeen months, five venues are enough to account for almost all volume: 96.7% for BTC/USD and 97.3% for ETH/EUR. Concentration is so high that the top two platforms alone capture 77% of BTC/USD and 60% of ETH/EUR. Measured by the Herfindahl-Hirschman Index, it reaches roughly 3,200 (BTC/USD) and 2,800 (ETH/EUR), above the 1,800 mark that competition authorities label a highly concentrated market. Economically, only a handful of markets matter.
And they are always the same ones. Over seventeen months, only two platforms ever held the top spot in BTC/USD (Crypto.com, 371 days; Coinbase, 146 days); only four did in ETH/EUR. The bands in the charts stay almost flat: the ranking does not reflect market noise, it is structurally stable over time. That is exactly the property one wants from a principal market: robust, and therefore reproducible from one measurement date to the next. Moreover, the venues that emerge (Coinbase, Kraken, Bitstamp, Crypto.com, Binance, OKX) are precisely the large, established platforms operating under significant market and regulatory scrutiny that charge real trading fees. Volume does not point to unknowns: it spontaneously selects the most trustworthy players, with no need to assign them any grade at all. Trust is not a precondition for volume; it is its observable consequence.
Read side by side, the two figures deliver the decisive blow to institutional scoring: the right market depends on the asset and its currency, not on the platform's overall reputation. Crypto.com is 42% of BTC/USD but under 1% of ETH/EUR; conversely, Binance is 31% of ETH/EUR but 0.01%, effectively nothing, of BTC/USD; OKX runs from 14% on one to 1% on the other. A trust grade assigned to the institution as a whole would include or exclude Binance wholesale and would necessarily be wrong for one of the two markets. Excluding a venue because the exchange is poorly rated would here mean discarding nearly a third of the genuine price information for ETH/EUR; including it indiscriminately for BTC/USD would mean importing a market that does not exist. Only a volume-based designation, carried out market by market, captures this reality. Volume is at once the revealer of trust and the only criterion that scales correctly to the level where valuation is actually decided: the market for the asset.
A 30-day window: current without being unstable
Measuring volume over a rolling thirty-day window strikes the right balance between freshness and stability. The window is short enough to reflect regime changes like a liquidity migration, a platform falling into distress, without the lag of a quarterly review, and long enough to smooth daily noise and resist transient spikes. The relevant market thus tracks economic reality rather than anticipating it with judgment or trailing it by months.
Two objections, quickly settled
“But isn't volume inflated by wash trading?” It is the classic objection and it does not argue for scoring, quite the contrary. First, the genuine volume of major assets concentrates, as we have just seen, in a handful of credible, accessible venues, where wash trading is negligible. Second, where doubt remains, a single, transparent filter suffices: keep only venues that charge real trading fees which materially reduces the economic incentive for wash trading and corroborate volume across several independent sources. That is far more defensible than a proprietary two-hundred-metric score: one corrects the signal with a legible rule, not with a black box.
“But isn't volume arbitrary too?” No, quite the opposite. Far from a private convention, the volume criterion mirrors the central logic of fair value measurement: IFRS 13 and ASC 820 look to the principal market for the asset, meaning the market with the greatest volume and level of activity that the entity can access at the measurement date. Relying on volume is therefore not a way around the accounting framework; it is a transparent way to operationalize the principal-market concept through a single observable, reproducible quantity which a proprietary score is not. The access condition also disposes of the edge cases: a platform that freezes withdrawals instantly stops being an eligible market, without waiting for a ranking's next review.
Conclusion: simpler, and enough
To recap. Selecting platforms with a composite score means stacking discretionary choices, incommensurable criteria, arbitrary weights, fragile tests, self-reporting, conflicts of interest, and the confusion between the institution and the asset's market for a result that is neither reproducible nor neutral. None of it is necessary. Volume (single, observable, auditable) sums up what the scores try to measure, holds up in the data (the same handful of venues concentrate the bulk of trading, market by market), and matches the accounting definition of fair value. It does not replace trust with a shortcut: it is trust's revealed measure. In a word: volume is enough. That is the method we apply at Koinju, a principal market designated by the highest 30-day volume, accessible and corroborated, for a fair value anyone can recompute and defend.
Methodological note: measuring concentration
Data: 517 daily observations, 30-day rolling window, 1 Jan 2025 – 1 Jun 2026 (source: Koinju).
Top-5 coverage: averages of 96.8% (BTC/USD) and 97.6% (ETH/EUR), with floors of 95.6% and 96.2%; the top five exceed 95% on 100% of observed days, for both pairs.
Herfindahl-Hirschman Index (HHI): averages of ~3,200 (BTC/USD, never below 2,600) and ~2,800 (ETH/EUR), above the 1,800 threshold deemed a highly concentrated market.
Leadership stability over seventeen months, only two venues ever held the top spot in BTC/USD, four in ETH/EUR.
References
IASB, IFRS 13, Fair Value Measurement: definition of the principal market (greatest accessible volume and activity) and the exit-price notion.
FASB, ASC 820, Fair Value Measurement: determination of the principal (or, failing that, most advantageous) market.
FASB, ASU 2023-08, Crypto Assets (Subtopic 350-60), December 2023: fair-value measurement of crypto assets through net income.
U.S. Department of Justice & Federal Trade Commission, Merger Guidelines (2023): a market is 'highly concentrated' above an HHI of 1,800 (threshold used in the methodological note).