Hyperliquid perpetuals data is now in our API.
Hyperliquid Data Now Available: What On-Chain Trading Reveals
Date
Author
Gautier Humbert, Research Analyst

Hyperliquid has processed over 151 billion dollars in spot and perpetual futures volume since 01/01/2026, establishing itself as the first fully on-chain orderbook for leverage trading.
As we integrate Hyperliquid into our public data infrastructure, we analyzed 3 weeks (from 05/01/2026 to 25/01/2026 included). A few observations stood out:
465 markets, 58 millions trades, 122 billion dollars of volume
220x difference between average ($2,600) and median ($11.78) trade size — indicating significant whale activity. The distribution is heavily skewed by large trades. While half of all trades are under $12, a subset of high-value transactions pulls the average upward by over 220x. This pattern is typical of markets where both retail and institutional participants coexist.
81% of trading volume concentrated on just 3 perpetuals markets — BTC/USDC, ETH/USDC, and SOL/USDC dominate liquidity.
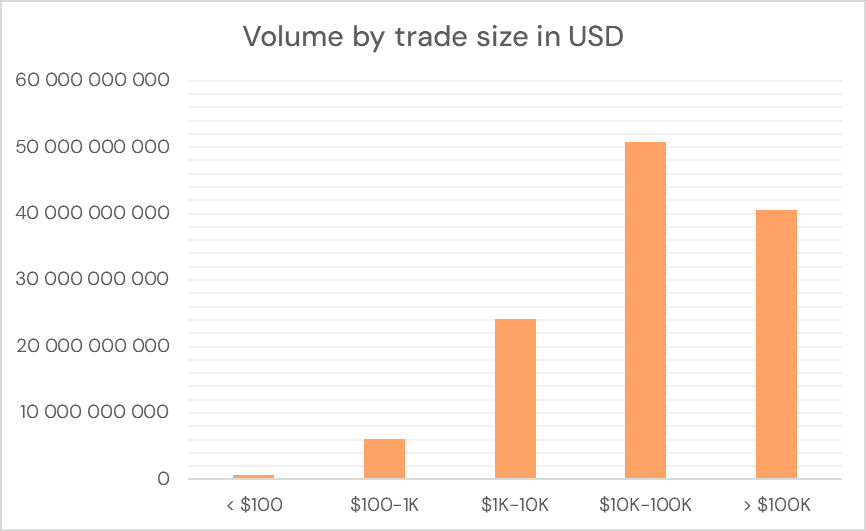
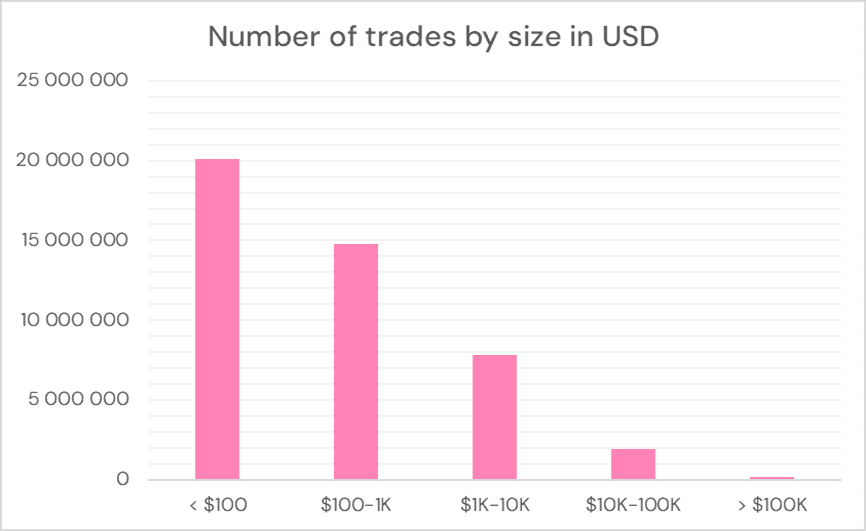
The charts represents cumulative spot and perpetuals markets.
These numbers reveal the rapid maturation of on-chain leverage trading, with liquidity depth approaching centralized exchange levels on major pairs.
For institutional players managing crypto portfolios, this integration matters: funds trading on Hyperliquid need the same data completeness and audit trail they expect from traditional exchanges. That's where our infrastructure comes in.
But first, let's understand why Hyperliquid represents a fundamental shift in how perpetual futures work.
Why Hyperliquid Matters?
The On-Chain Orderbook Difference
Unlike traditional decentralized exchanges that use Automated Market Makers (AMMs), Hyperliquid runs a fully on-chain orderbook for perpetual futures and spot trading. This architecture combines the transparency and composability of DeFi with the capital efficiency and user experience of centralized exchanges.
Technical context:
First L1 blockchain purpose-built for perpetual futures
On-chain limit orders and matching engine (not AMM pools)
HyperEVM for smart contract composability
Sub-second block times for near-CEX latency
Why institutions care:
For fund administrators and asset managers, on-chain perpetuals present a unique challenge: they require the same rigorous data standards as centralized venues, but the data lives on a blockchain rather than a WebSocket feed.
Positions opened on Hyperliquid appear in portfolio snapshots. Trades executed there impact P&L calculations. For regulatory reporting and audits, "we think we got all the trades" isn't good enough—you need mathematical certainty.
This is exactly the problem our reconciliation infrastructure was designed to solve, whether data comes from a centralized API or a blockchain.
Now that Hyperliquid data flows through the same validation pipeline as our other exchanges, here's what we're making available.
What's Available in Our API
Trade Data
We capture all trades across 465 active markets on Hyperliquid, with the same provable completeness guarantee we provide for centralized exchanges.
What's included:
Real-time trade streaming + historical backfill
Complete trade details: price, quantity, side, timestamp, trade ID
Blockchain metadata: block number, transaction hash
Quality assurance via our gap detection system
Market Coverage
We currently track 465 active markets on Hyperliquid, but the distribution reveals a clear hierarchy of institutional interest.
Where the Liquidity Is
The Big Three: 81% of Volume
- BTC/USDC perp — 48% of total volume
- ETH/USDC perp — 25% of total volume
- SOL/USDC perp — 7% of total volume
These three markets alone account for 81% of all trading activity on Hyperliquid. This isn't surprising—it mirrors what we observe across all institutional-grade venues, whether centralized or decentralized.
Unlike traditional market data providers who focus on "top markets," we maintain the same rigorous validation across all pairs. When a fund holds a $50K position in a niche altcoin perpetual, they need the same audit-grade data as for their $5M BTC position.
Why this concentration matters
For institutional players, this means:
- Deep liquidity on core markets for large position entries/exits
- Tighter spreads on high-volume pairs
- Opportunity in the long tail: the remaining 19% of volume is distributed across [X-3] markets, offering specialized exposure
For fund administrators, it simplifies reconciliation. The bulk of client positions sit in three highly liquid markets with continuous price discovery and minimal reporting edge cases. For quantitative traders, it concentrates arbitrage opportunities. Cross-venue spread compression happens where volume is deep, not where it's fragmented across illiquid long-tail pairs. For risk managers, it means cleaner hedging. You can offset exposure in the same markets where institutional counterparties are active, rather than manufacturing liquidity in obscure pairs.
The Specialized Long Tail: 19% Across 462 Markets
The remaining markets serve specific use cases:
- Major altcoins: AVAX/USDC, XRP/USDC, HYPE/USDC
- DeFi blue chips: UNI/USDC, AAVE/USDC
- Emerging L1s: SUI/USDC, APT/USDC
- Memecoins: DOGE/USDC, PEPE/USDC
While individually smaller, these markets provide:
- Tail risk exposure for multi-strategy funds
- Sector-specific plays (DeFi, L1s, gaming tokens)
- Alpha generation in less-efficient markets
For comprehensive portfolio tracking, having complete data across all markets—even the long tail—ensures nothing falls through the cracks during monthly reconciliation.
Aggregated Data
Pre-computed candles eliminate the need to aggregate millions of raw trades:
- OHLCV candles: 1m, 1h, 1d intervals
- Volume metrics: Total notional, trade count per candle
- Statistical measures: VWAP, standard deviation, volume-weighted volatility
All candles are built from our complete, validated trade dataset—not sampled or estimated. For backtesting and risk modeling, this completeness is non-negotiable.
If there's a specific Hyperliquid data type you need for your strategy or reporting workflow, let us know—client demand shapes our roadmap.
Let's see how simple it is to query this data.
Quick Start Examples
Querying Hyperliquid Data
Our SQL and REST APIs provide the same interface for Hyperliquid as for any other exchange we support. If you're already querying Coinbase or Binance data through Koinju, adding Hyperliquid requires zero code changes—just filter by exchange='hyperliquid' or exchange='hyperliquid-future'.
Example of usage : 3 weeks of daily candles for BTC-USD perpetual on Hyperliquid
Full API documentation: here
Who needs this data, and what can they do with it?
Who Benefits from Hyperliquid Data?
Crypto Funds & Asset Managers
Unified portfolio tracking across CEX and DEX positions
Single P&L calculation covering all venues
Audit-ready data with provable completeness for compliance
Quantitative Traders
Cross-venue arbitrage between Hyperliquid and centralized perpetuals
Backtesting on-chain perpetuals strategies
Fund Administrators
Automated reconciliation for clients trading on Hyperliquid
NAV calculations with complete trade history
Regulatory reporting (eg. IFRS, GAAP)
Researchers & Analysts
DeFi vs CeFi perpetuals liquidity comparison
On-chain market microstructure research
Collecting blockchain data at this scale presents unique technical challenges. Here's how we adapted our infrastructure.
Ready to start building with Hyperliquid data?
Get Started with Hyperliquid Data
Hyperliquid represents the next evolution of perpetual futures—fully on-chain, transparent, and composable. Our API brings the same institutional-grade data quality to on-chain perpetuals that clients expect from traditional exchanges.
Start exploring:
📘 API Documentation: read it here
🔍 Try our SQL interface: Book a demo
💬 Questions about your use case? Contact us
Related reading: